Every number has a story. Inspect it.
Inspect the training-data review, held-out benchmarks and the limits of the research preview. Historical results are preserved for traceability; they do not validate hydrostatic performance or accuracy on a customer’s next batch.
Corrected data, fresh benchmark
The review confirmed 70 curated observations entering two strength import paths and 39 primary observations losing reported non-default rates. The corrected pipeline preserves rates and reviewed measurement identities, keeps distinct repeats, and excludes 96 strength observations with unknown rates from fitting.
The designer grid now uses the corrected fits. These results hold out a whole canonical campaign at a time, with 8 optimizer restarts and preprocessing fitted on each training fold. Source, rate, matrix and membership corrections changed the evaluation cohort; differences from the historical archive cannot be attributed to one fix alone.
| property | rows / campaigns | median error | middle 50% of errors | 90th percentile | within ±20% | observed nominal 90% coverage |
|---|---|---|---|---|---|---|
| Stiffness | 218 / 15 | 16.4% | 7.3–35.0% | 54.1% | 58.3% | 72.9% |
| Uniaxial compressive strength, all reported rates | 390 / 14 | 17.3% | 7.8–37.1% | 58.7% | 54.6% | 74.9% |
| Strength, reported rate ≤0.1 /s | 113 / 14 | 10.3% | 4.8–18.3% | 35.5% | 77.9% | 94.7% |
| Strength, reported rate >0.1 /s | 277 / 8 | 23.5% | 10.2–43.2% | 63.2% | 45.1% | 66.8% |
Error is |predicted − measured| ÷ measured. On the same stiffness rows, the textbook Mori–Tanaka estimate has 50.8% median error and 22.9% within ±20%. Equal campaign weighting gives mean interval coverage of 63.4% for modulus and 69.3% for strength; row weighting can give a different impression.
Giving each campaign equal weight changes stiffness median error to 23.0% and the share within ±20% to 47.7%. Large errors remain in the evaluation: the worst relative errors are 579.2% for stiffness and 6645.4% for strength. The median is not a bound on a new prediction.
The strength cohort is primarily epoxy; its small vinyl-ester subset comes from one campaign and does not establish broad vinyl-ester strength support. Non-epoxy strength cannot satisfy a requirement in the designer. Individual specimen and batch identities remain unknown in much of the literature. Remaining source overlaps need review. This rerun is literature cross-validation, with no independently reserved factory test set, calibrated coverage guarantee or hydrostatic validation.
Aggregate results, method and artifact hashes →Underwater validation is a separate research programme
The pressure evidence registry contains seven published summaries from three campaigns and zero new laboratory measurements. These are reference observations, not a validated hydrostatic predictor. Published test methods now guide the proposed batch and durability study.
Read the paper findings and six-week plan →New elastic reference: 16 vinyl-ester foam Poisson-ratio summaries plus one neat-resin summary from Poveda, Gupta and Porfiri (2010). These are separate from the seven hydrostatic summaries and do not add pressure-validation measurements. How E, Poisson’s ratio and bulk modulus relate.
Historical benchmark archive
Every figure in this archive comes from the previously saved leave-one-paper-out predictions, recomputed on 2026-09-27 by a script whose inputs are hashed. The public export contains aggregate statistics only; individual records and paper-level annotations remain in the private corpus. Strength results include defaulted rates and overlapping imports identified on 3 October; their rate strata and laboratory-adjustment comparisons must not be used as current accuracy claims. A median error of 18 % means half the predictions are better than that and half are worse; it does not mean 82 % accuracy. The columns that matter for a decision are the tolerance bands and the tails.
Historical nominal 90% coverage: 74.5 % for modulus (247 rows) and 82.6 % for strength (581 rows). These figures belong to the old saved models; see the corrected release above for current evaluation.
| model | rows | median error | middle 50 % | 90th percentile | within ±20 % | within ±25 % | rows over 100 % | typical factor | rank agreement | coverage of nominal 90 % intervals |
|---|---|---|---|---|---|---|---|---|---|---|
| FoamForge stiffness (modulus) | 247 | 17.6 % | 9–34 % | 48.8 % | 53 % | 61 % | 9 | ×1.47 | 0.46 | 74.5 % |
| Textbook Mori–Tanaka, same rows | 247 | 49.5 % | 23–99 % | 205.5 % | 23 % | 28 % | 56 | ×1.84 | 0.23 | none |
| FoamForge strength, all rates | 581 | 17.4 % | 8–35 % | 54.5 % | 56 % | 62 % | 20 | ×1.52 | 0.68 | 82.6 % |
| Strength, quasi-static (≤ 0.1 /s) | 325 | 10.9 % | 5–21 % | 30.8 % | 75 % | 81 % | 2 | ×1.50 | 0.81 | 94.2 % |
| Strength, dynamic (> 0.1 /s), provisional | 256 | 33.6 % | 16–48 % | 76.9 % | 33 % | 39 % | 18 | ×1.55 | 0.41 | 68.0 % |
Error is |predicted − measured| ÷ measured per row. Typical factor is exp(log-RMSE): ×1.47 means a typical miss is a factor of about 1.5 either way. Rank agreement is the Spearman correlation between predicted and measured across all rows; inside a single paper it is 0.7 to 0.95 for ten of the fifteen papers with five or more strength rows, which is what matters when the question is which candidate to cast first. Pooled R² on the raw MPa scale is -0.10 for stiffness and 0.29 for strength; it is dominated by between-paper level differences and a handful of extreme rows, and is reported here because it was asked for, not because it is the right yardstick for a multi-laboratory literature model. The model’s central tendency is 13 % low on stiffness; the textbook’s is 50 % high.
Historical laboratory-adjustment diagnostic
Exploratory, on the archived predictions. Each row is adjusted using exp(median(log(measured/predicted))) from at least three distinct other measurement keys in the same paper. All copies of the target key are excluded, and each remaining key contributes once. The legacy strength rate column includes imputed rates; this diagnostic does not establish the corrected model’s benefit. The paper is in-sample, so this is optimistic, not an independent customer evaluation. Keys are proxies for measurements, not verified specimen or batch identities. The private calibration service uses the same estimator per matrix family, with additional input screens and a three-composition minimum that this audit does not validate.
| eligible comparison | median | 90th pct | within ±20 % | within ±25 % |
|---|---|---|---|---|
| Stiffness, model alone | 17.3 % | 47.8 % | 54 % | 62 % |
| Stiffness, with the laboratory’s factor | 12.7 % | 43.8 % | 65 % | 76 % |
| Stiffness, textbook alone | 49.0 % | 199.4 % | 23 % | 28 % |
| Stiffness, textbook with the same factor | 17.0 % | 44.8 % | 54 % | 63 % |
| Quasi-static strength, model alone | 10.7 % | 30.5 % | 76 % | 82 % |
| Quasi-static strength, with the laboratory’s factor | 9.5 % | 22.5 % | 84 % | 93 % |
Stiffness rows: 242; quasi-static strength rows: 309. The textbook improves more in absolute terms from the same factor than the model does, from 49.0 % to 17.0 % median against 17.3 % to 12.7 %. After the same factor the model remains the better predictor (65 % against 54 % within ±20 %). Neither result isolates a causal laboratory effect. Eligible evaluation rows retain their original weights, including matching keys; the row counts do not establish independence.
Detailed validation records stay private
The aggregate scorecard and error distributions include the large misses. Individual measured values, prediction pairs and paper-level annotations are retained in the private corpus for source review and controlled technical diligence.
The rows are not all independent
The 581 saved strength-validation rows contain 176 additional rows with the same paper, volume fraction, particle density, strain rate and measured strength, leaving 405 distinct combinations. These combinations are not verified independent specimens. Whether matching rows represent repeated extraction or true replicates still needs source review. This is a separate check from the 291 repeated entries removed from the sharing workbook. Keeping the first row of each combination gives a historical sensitivity check: median 17.2 %, 57 % within ±20 % (quasi-static: 11.6 %, 73 %). This does not retrain the model. Equal weighting of papers gives 71.8 % modulus and 81.1 % strength interval coverage. These are historical cross-validation results, not independent factory or hydrostatic validation. Interval audit · Error audit with source hashes.
What changed in the product because of this
- provisionalDynamic-rate strength remains exploratory. Archived errors are labelled historical rather than presented as expected customer performance.
- calibrateThe designer fits factors per matrix family and property from at least three distinct compositions, and reports in-sample scatter rather than forecast accuracy. Matching property measurements count once, including equivalent numeric formats. Strength requires an explicit positive rate ≤ 0.1 /s; missing, invalid and dynamic rates exclude that strength value. Invalid supplied densities and densities more than 15 % from the rule of mixtures exclude the record; blank density is marked unscreened. Loading must be within 5 to 60 vol %. Batch IDs are metadata; a matching resin, cure or process is not verified. Scaled intervals have no established coverage. Independent batches must test the benefit.
- disclosedThe designer now states the corrected campaign-held-out distribution beside its predictions. Current results and uncertainty limits appear in the reviewed release above; archived figures do not describe expected customer performance.
- pendingSource review of the worst rows and remaining ambiguous overlaps; independent batch evaluation and interval calibration on whole held-out campaigns. Equal measured values alone do not establish duplicate reporting.
Data: current workbook and historical validation
Workbook review · 27 September 2026
The expert compilation now retains 2,792 property entries, down from 3,083 after removing 291 repeated entries across two strain-rate tabs. Each pair matched on paper, sample, test conditions, units and value, and both source cells were checked. The workbook’s Duplicate log preserves every removed entry and its source location.
The separate literature database still contains 1,781 records from 130 papers. No exact duplicates were found there after excluding Record ID. The October pipeline review resolves specific import and republication identities; broader source review remains incomplete, so these counts are not additive or counts of independent experiments. The sharing workbook is not itself the training cohort. The archived predictions above have not been changed by either review.
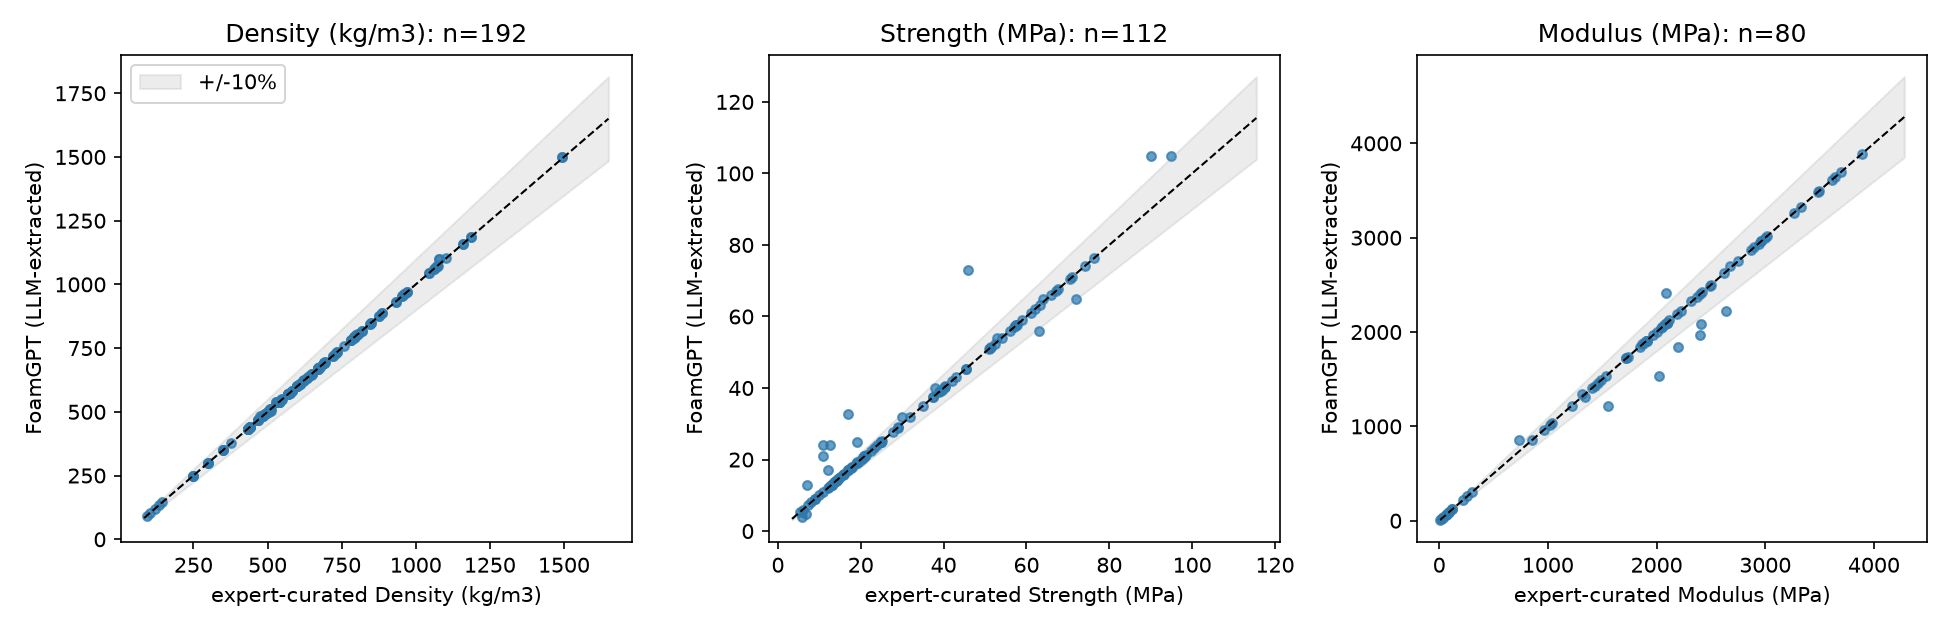
The stored database holds 1,781 extracted records from 130 papers, including primary, secondary and model-derived entries. The fitted and evaluated subsets are smaller. Against the professor's own hand-built compilation, 192 record pairs across 30 papers: every density matches, 90 % of moduli and 88 % of strengths agree within 10 %. This historical subset comparison checks transcription agreement, not independent predictive performance; not every stored row has been manually audited.
Findings the verifiers surfaced
Idealised models over-predict real foams
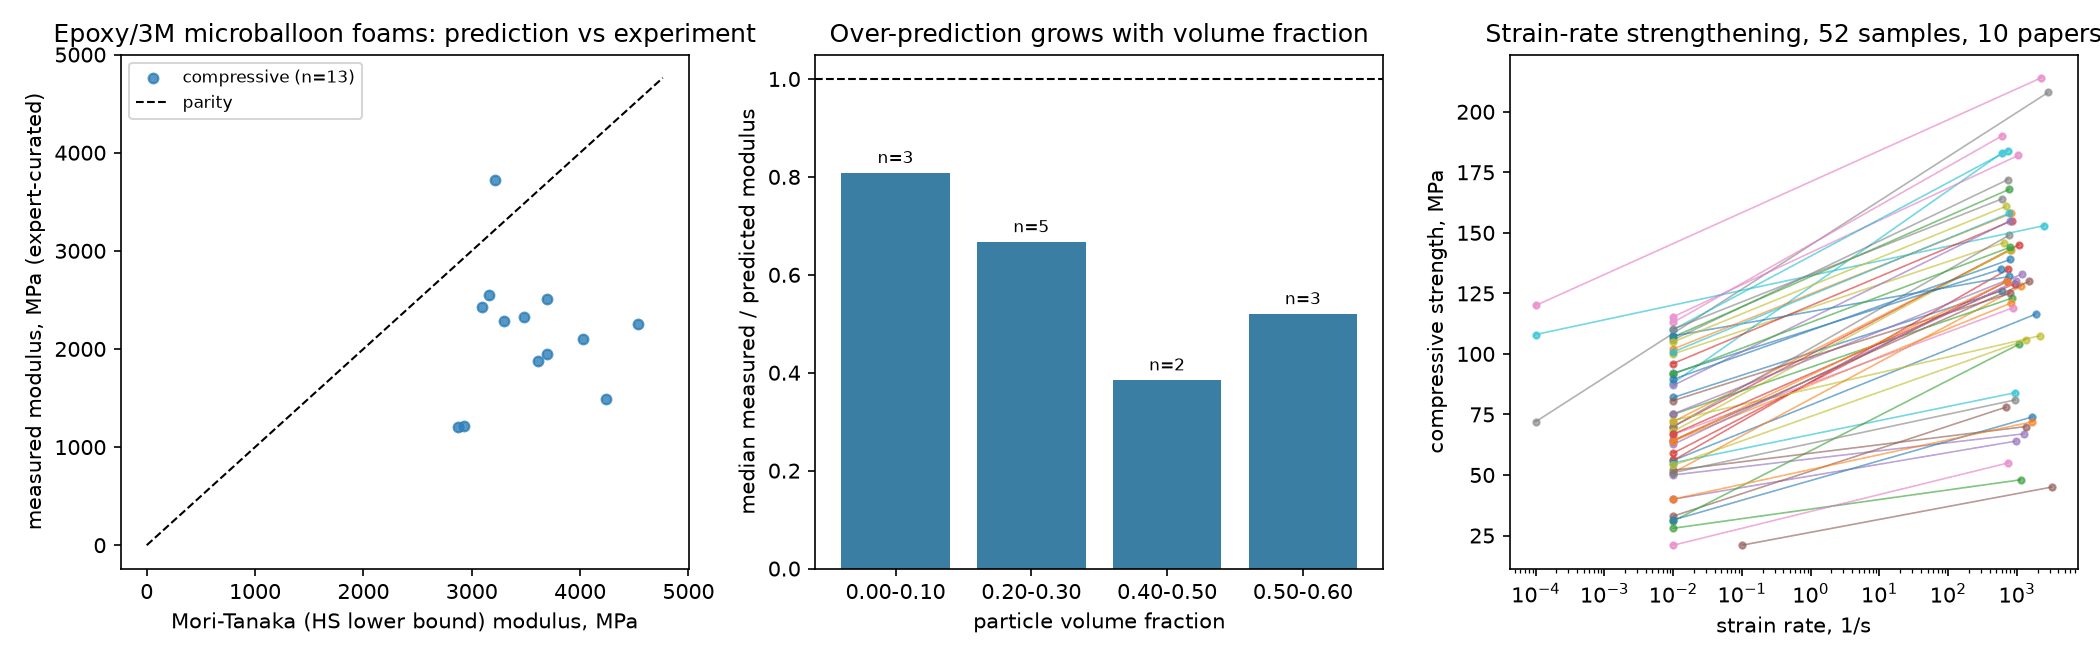
Historical analysis of the original 3,083-entry expert compilation found over-prediction of 20 % at low loading and a factor of two above 40 vol %. The current sharing workbook retains 2,792 entries after removing repeated entries. This analysis and the fitted surrogate have not been rerun on that revision.
Shell-buckling crush estimates are sevenfold high
Historical analysis across 65 records labelled quasi-static found the classic estimate was an upper bound only. It cannot establish hydrostatic collapse strength. Historical strength accuracy and rate strata also inherit the pipeline limitations identified in the October review.
Variation between laboratories matters
The historical fit estimated a between-laboratory factor of 1.25 at one sigma. Two of its largest stiffness misses were whole papers whose measured moduli sat at a third of both model and textbook estimates. The designer can explore an adjustment from a laboratory’s own records; its benefit on new batches and the causes of the discrepancies remain unverified.
Executable is not correct
Our own first convergence driver stopped after two agreeing meshes and was rejected by the verifier; an AI agent read our answer key through a leak and found a defect in it. Both are fixed and documented, and both are why the verifier layer exists.
Metal-matrix stiffness needs careful interpretation
In the reviewed metal corpus, apparent moduli from crosshead displacement can reflect specimen and machine compliance. These values are excluded from the elastic-modulus fit. The metal strength model remains future work. The 120 metal simulations are retained for benchmark and numerical verification only.
Detailed evidence can be reviewed through an agreed technical-diligence process. Public summaries do not distribute the training corpus or model parameters.