03 / FOAMFORGE
Underwater research
The next frontier starts with an experiment.
We are developing a workflow to connect foam composition and manufacturing history with measured pressure response and retained buoyancy. The first goal is to test whether it selects useful formulations more efficiently than the laboratory's current method.
7 published summaries
Three hydrostatic campaigns in the reference registry. Published summaries remain separate from individual specimen observations.
0 new pressure measurements
The catalogue currently exports draft laboratory requests. No candidate has an experimentally established depth rating.
Optional six-week lab study
A separately scoped research programme, conditional on equipment, materials and the laboratory's approved protocol. Physical tests are not included in the commercial evaluation fee.
Particle Lab · saved FE examples
Look inside the elastic calculation
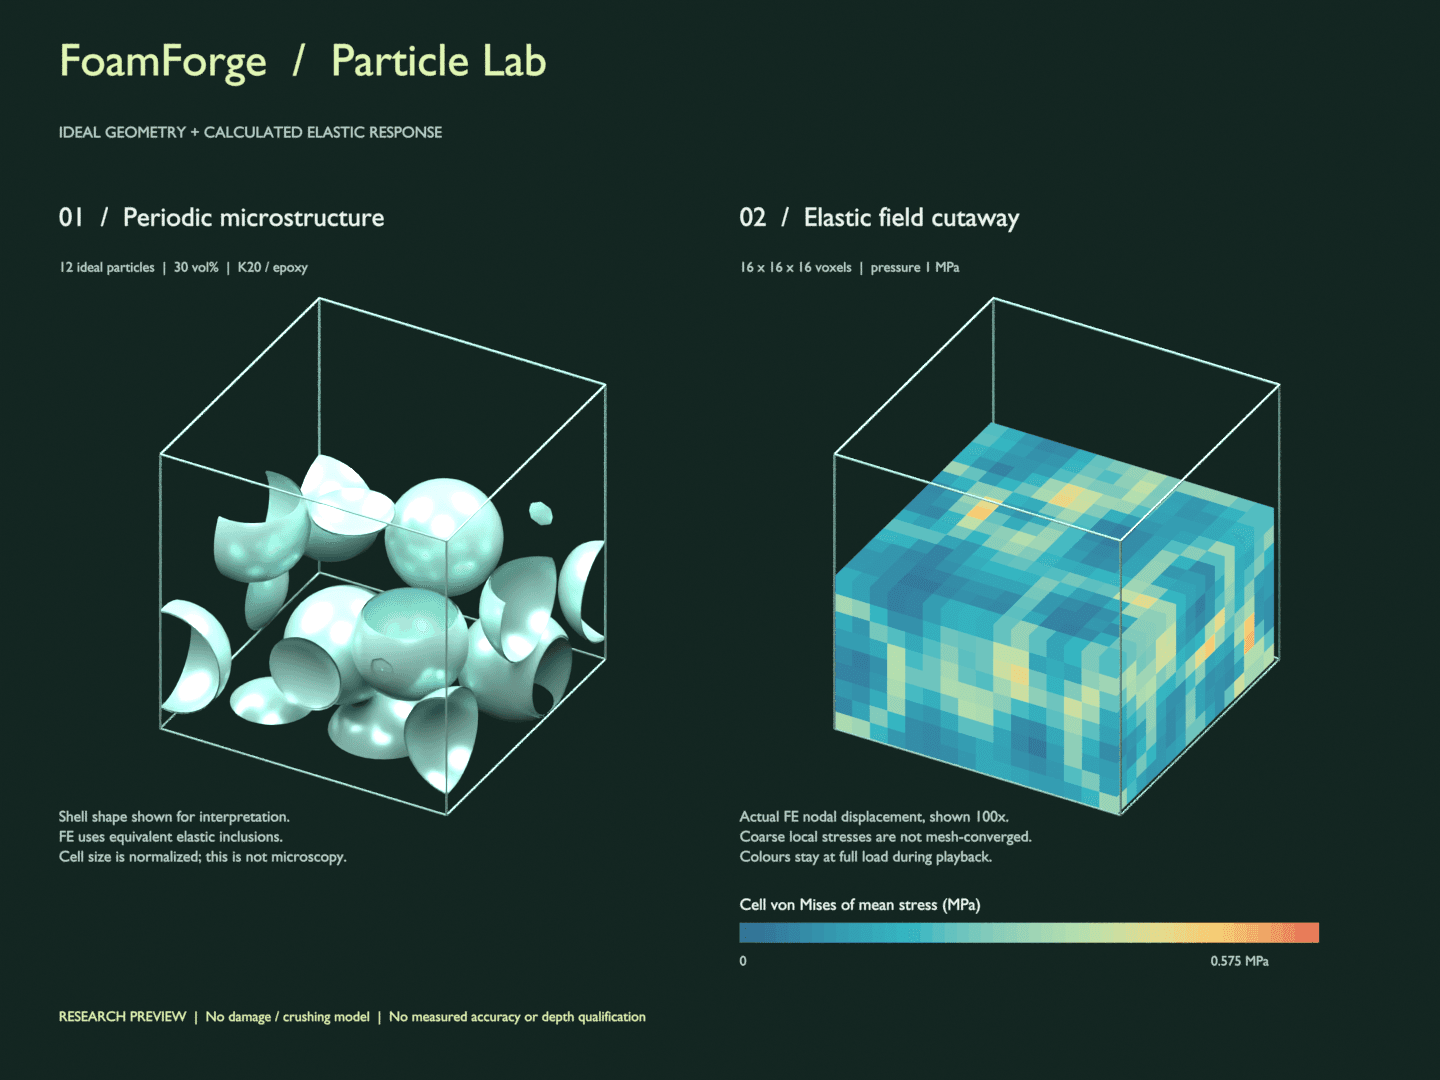
Inspect the same calculated fields used in our offline Blender scene. Compare two particle grades under identical generic epoxy, loading and packing assumptions. The controls below linearly rescale saved results; they do not run Blender or solve new physics.
Loading saved FE examples…
Research preview: no particle crushing, mixing damage, debonding or water uptake is modelled. These examples have no matched experimental validation and do not establish material substitution suitability or a depth rating.
See the offline Blender scene and modelling assumptions
Blender is used offline to inspect geometry and display FoamForge's FE output. The visible hollow shells illustrate ideal geometry; the elastic solver replaces each shell and cavity with an equivalent inclusion. It does not resolve local shell failure. The browser viewer above shows actual FE surface cells, not animated particle collisions.
The resin uses generic E = 3,000 MPa and ν = 0.35. The assumed 40 µm equal particle diameter is a scale reference, not a verified size distribution. Changing the grade changes the assumed equivalent particle properties, without changing packing or particle loading. The common stress scale makes that comparison visible without independently normalising each image.
Inspect both saved field exports and source hashes →From elastic response to a tested failure model
The particle lab shows how an ideal, intact material deforms under pressure. Predicting when it breaks requires a separate research programme, tied to a specific formulation and measured failure endpoint.
1 · Match the material
Confirm resin and cure, particle grade and size distribution, loading and free voids. Compare several particle arrangements and finer meshes before interpreting elastic trends.
2 · Model the observed failure
Begin with an imperfect hollow shell, then a sphere embedded in resin. Add the damage, interface or contact behaviour supported by observations. A particle crush datasheet value alone cannot establish cured-foam failure.
3 · Test frozen predictions
Agree a pressure–volume and unloading protocol with the engineer. Fit using one set of batches, then compare predictions with separate, previously unseen batches. Report errors and interval coverage for the agreed endpoint.
Published hydrostatic measurements can help reproduce a reference case while laboratory access is arranged. They do not validate a new partner formulation. Hydrostatic strength study · Pressure–volume test method.
Papers that change the experimental plan
Full texts reviewed. These findings guide the measurements and validation design; they do not establish performance for our proposed formulations.
Poveda, Gupta and Porfiri · 2010
Published finding
Sixteen vinyl-ester foam compositions have reported mean Poisson ratios from 0.295 to 0.373. The neat resin’s E is 2.92 GPa and its mean Poisson ratio is 0.351.
How we will use it
Use composition-specific Poisson-ratio evidence and match it to Young’s modulus before estimating isotropic bulk modulus. Preserve repeated-measurement structure and source-table flags.
Scope: No individual foam E values, hydrostatic bulk moduli or pressure–volume curves. Two specimens per foam were repeatedly tested. The VE460-40 value and four density/void-content rows require clarification.
Walden, Tessier and Popenoe · 2010
Published finding
Coupons taken from block ends can miss composition gradients and stresses caused by curing. The Alvin programme moved toward testing complete production blocks.
How we will use it
Record the manufacturing batch, casting block and coupon position. Evaluate transfer to larger blocks when the pressure vessel permits.
Scope: Historical Alvin-specific requirements. Its pressure factors and acoustic-emission thresholds are not a current universal qualification procedure.
Le Gall and colleagues · 2014
Published finding
At 20°C, the epoxy foam's reported hydrostatic crush pressure was 83.0 ± 1.7 MPa; its uniaxial stress at break was 97.8 ± 5.2 MPa. The two loading modes provide different information.
How we will use it
Measure pressure response directly and correct buoyancy measurements for water density at the test pressure and temperature. Preserve the endpoint definition.
Scope: Two material systems with different failure behaviour. The reported spreads are not prediction intervals, and the results do not establish a universal conversion factor.
Poveda, Dorogokupets and Gupta · 2013
Published finding
After six months in room-temperature deionized water, the study reports about a 30% reduction in quasi-static compressive strength, while modulus was largely unchanged.
How we will use it
Track water uptake and residual strength separately. Preserve the drying, surface-water handling and weighing protocol alongside each specimen's exposure history.
Scope: Carbon-nanofiber-reinforced foams under immersion. These are not hydrostatic lifetime measurements and cannot be pooled with ordinary foams without accounting for reinforcement.
Optional laboratory research programme
Step 1
Week 1 · define the measurement
Choose one resin family and one use case. Establish rig repeatability, pressure and temperature limits, failure definitions and traceable batch records.
Step 2
Weeks 2–3 · build a pressure dataset
A proposed screen uses two microsphere grades, three loadings and three specimens per composition: 18 destructive-test specimens. Allocate separate controls and immersion specimens, and identify independent manufacturing batches.
Step 3
Weeks 3–4 · compare selection methods
Compare a simple engineering baseline with a direct pressure model. Keep replicas and related publications together when splitting data. Begin water-exposure tracking without claiming long-term lifetime.
Step 4
Weeks 5–6 · test frozen predictions
Make and test fresh batches after freezing candidate rankings. Compare pass rate, density and experimental effort at an equal testing budget. A small study can assess feasibility; dependable interval coverage requires more independent batches.
What would make this useful
A useful result is a repeatable improvement in selecting a manufacturable foam that meets a customer's pressure, buoyancy-retention and density requirements. We will measure that improvement against an agreed baseline before claiming savings.
Hydrostatic models and water-uptake models already exist. Our proposed contribution is a traceable selection-and-test workflow, validated on new manufacturing batches. Its novelty and commercial value remain hypotheses to test.
Additional foundations: Liu et al. 2019, Loubrieu et al. 2022, and Loubrieu et al. 2023. Licensed paper files remain in the collaboration library; this site provides citations and summaries.